


The Chrome Developer Tools
are a bit quirky, but for script debugging I currently like them the
best. Here is a quick brain dump on some areas of interest (these are
all in the stable build 17.0.963.79).
The second button opens the Console, which is a helpful JavaScript REPL. You can execute script code in the current debugging context, meaning you can manipulate the DOM, try different CSS selectors with jQuery, or call into libraries loaded on a page to figure out how an API works. Tip: To enter code that spans multiple lines use Shift+Enter to end a line. The console also displays errors, warnings, and log messages, and provides autocompletion (the right arrow key seems to be the safest way to complete, as the ENTER key sometimes doesn't work (I said it was quirky)).
The third button is the "click an element on the page to inspect it" button.
The fourth button toggles the break on exceptions behavior. The debugger can break on all exceptions, break on unhandled exceptions only, or ignore exceptions. Break on unhandled exceptions is a fast way to find broken code.
The fifth button is the pretty print button. If you are trying to step through minified source code to find a bug in a production library, the pretty print feature will at least give you the proper line breaks and white space to read the code. Unfortunately, local variables will still be minified and look like variables from a Fortran program circa 1972 (I,j,k).
The sixth button is the live edit button, where you can click the the source code and change the code on the fly. Like the console window, this is a useful feature to have when you are still trying to figure out how things work. After you change the code the changes are live in the browser and working.
The tools also provide DOM breakpoints, which I use when I'm trying to find who is responsible for changing something in the DOM. With an element selected in the Elements tab, you can right-click and set up a breakpoint if an attribute on the element changes, if someone adds or removes a descendant element, or if someone removes the element from the DOM.
CPU profiling help you find the functions where a page is spending most of its time.

The heap snapshots are thorough, but it can take some work to go from seeing there is an array holding 10MB of data to figuring out the who, what, where, when, and why.
The Timelines tab also surfaces some interesting visualizations, particularly if you are troubleshooting a slow page load.
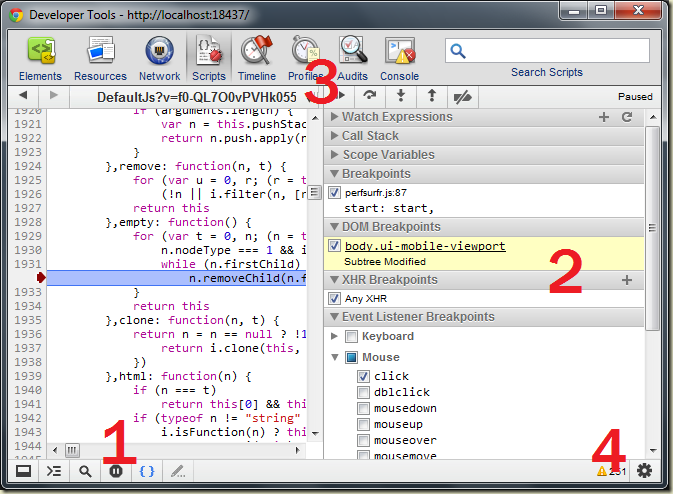
The Toolbar Under #1
The leftmost button allows you to dock and undock the tools window from the browser window.The second button opens the Console, which is a helpful JavaScript REPL. You can execute script code in the current debugging context, meaning you can manipulate the DOM, try different CSS selectors with jQuery, or call into libraries loaded on a page to figure out how an API works. Tip: To enter code that spans multiple lines use Shift+Enter to end a line. The console also displays errors, warnings, and log messages, and provides autocompletion (the right arrow key seems to be the safest way to complete, as the ENTER key sometimes doesn't work (I said it was quirky)).
The third button is the "click an element on the page to inspect it" button.
The fourth button toggles the break on exceptions behavior. The debugger can break on all exceptions, break on unhandled exceptions only, or ignore exceptions. Break on unhandled exceptions is a fast way to find broken code.
The fifth button is the pretty print button. If you are trying to step through minified source code to find a bug in a production library, the pretty print feature will at least give you the proper line breaks and white space to read the code. Unfortunately, local variables will still be minified and look like variables from a Fortran program circa 1972 (I,j,k).
The sixth button is the live edit button, where you can click the the source code and change the code on the fly. Like the console window, this is a useful feature to have when you are still trying to figure out how things work. After you change the code the changes are live in the browser and working.
#2 Area: Breakpoints
Like any debugger you can break on specific lines of code. You can also break into code starting an AJAX request (and break only on specific URLs). There are also event listener breakpoints. An event listener breakpoint is useful when you are trying to find who is responding to a click event, for example. Events include timer events, like setTimer, clearTimer, and the timer tick event handler.The tools also provide DOM breakpoints, which I use when I'm trying to find who is responsible for changing something in the DOM. With an element selected in the Elements tab, you can right-click and set up a breakpoint if an attribute on the element changes, if someone adds or removes a descendant element, or if someone removes the element from the DOM.
Profiles (#3)
Clicking on the profiles button will bring you to a tab with two primary features – the ability to start CPU profiling, and the ability to take a heap snapshot (once you are on the tab, look for the buttons in the #1 toolbar area).CPU profiling help you find the functions where a page is spending most of its time.

The heap snapshots are thorough, but it can take some work to go from seeing there is an array holding 10MB of data to figuring out the who, what, where, when, and why.
The Timelines tab also surfaces some interesting visualizations, particularly if you are troubleshooting a slow page load.
No comments:
Post a Comment